

The journey of statistics started from ancient times. Statistics have been used in various fields of human society. With the help of statistics, the significance of various data in various social sciences like pedagogy, psychology, sociology etc. is determined.
The English word ‘Statistics’ comes from state or state. The word Statistics is derived from the Italian word ‘Statista’, the Japanese word ‘Statistik’ and the Latin word ‘Status’. The word ‘Status’ was used in ancient times as a symbol of various state functions, apart from those words, which were required by the state for army formation, tax collection etc. Later, the population problem of the state, birth-death ratio, etc. required by the state would be expressed through numbers and meaningful interpretations could be made from it. Statistics is a special branch of mathematics but is now established as a separate discipline. In Mathematics, statistics concerns the collection of data, organisation, interpretation, analysis and data presentation. The main purpose of using statistics is to plan the collected data in terms of experimental designs and statistical surveys. Statistics is considered a mathematical science that works with numerical data. In short, statistics is a crucial process which helps to make the decision based on the data. Today, statistics refers to a science that deals with numbers or mathematical facts, consisting of various techniques and methods.
According to Bowley, ‘Statistics are numerical statements of facts in any department of inquiry placed in relation to each other’.
Webster defined statistics as the classified facts representing the condition of the people in a state, especially these facts which can be stated as numbers, or in a table of numbers or in any tabular or classified arrangement.
H. Secrist defined statistics as an aggregate of facts to a marked extent by the multiplicity of causes, numerically expressed, enumerated or estimated according to a reasonable standard of accuracy, calculated in a systematic manner for a predetermined purpose and placed in relation to each other.
Croxton and Cowden defined statistics as the collection, presentation, analysis and interpretation of numerical data.
Features of Statistics
1. Any qualitative data is not considered a statistic, it must be numerical.
2. A statistic is a set of numbers, no single number can be called a statistic.
3. The purpose of statistics is predetermined.
4. Statistics is the collection of data relevant to the achievement of a purpose.
5. In statistics, data are collected in such a way that they can be compared with each other.
6. New decisions are made based on statistical information.
Usefulness of Statistics in Education
1. In a scientific way, statistics helps simple and accurate interpretation of the educational data.
2. Statistics helps in gathering information about the appropriate quantitative data
3. Statistics have considerable utility in the analysis of data obtained from research in the field of education.
4. Statistics have a particular utility in assessment at the school level.
5. Statistics have particular utility in the standardization of educational and psychological pursuits.
6. It depicts the complex data in graphical form, tabular form and in diagrammatic representation to understand it easily
7. It is also particularly useful in comparing scores between students.
8. To arrive at any rational conclusion, it is necessary.
9. In organizing any kind of information.
Limitations of Statistics
1. If the data is not correct then the correct result is not available.
2. Qualitative data analysation is not possible.
3. Fails to conceptualize the individual without the collective.
4. Intentional misuse skews statistics.
5. Statistics do not always yield one result.
Frequency Distribution
frequency distribution, in statistics, a graph or data set organized to show the frequency of occurrence of each possible outcome of a repeatable event observed many times. Simple examples are election returns and test scores listed by percentile. A frequency distribution can be graphed as a histogram or pie chart. (britannica.com)
While tabulating scores, instead of repeating the results of students with the same score, write the numbers used next to those scores. Either way, this repeating number is called frequency, denoted by the symbol ‘f’. Or to put it in simple words, orderly alignment or segmentation of chaotic data is called frequency distribution. It is a scientific method of expressing mathematical facts in short form. Analyzing the marks obtained by the students in the annual examination in a school, it will be seen that a particular mark is obtained by one or more or none. The sum of the number of times a particular score occurs within a set of scores is called frequency. Eg- Out of 50 students in a class, 15 got 60. Here the number of 60 scores is 15. Statistically arranging the scores obtained from a measure is called frequency distribution.
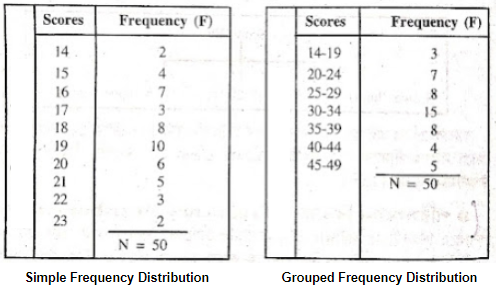
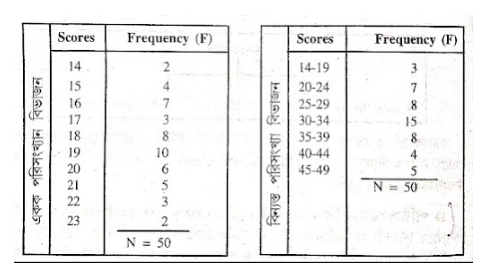
After collecting information, we should display it in a significant way for greater understanding. Organize the data such that all of its properties are represented in a table. It is known as frequency distribution. In statistics, there are four types of frequency distributions, which are discussed below: 1) Simple frequency distribution, 2) Grouped frequency distribution.
An example of Simple frequency distribution and Grouped frequency distribution is shown by a figure-
Importance of Frequency Distribution
The importance or necessity of frequency distribution is discussed below—
1. An idea about the nature of any score or its form can be formed by looking at the position of that number in the frequency distribution.
2. It is possible to make any score meaningful in short ranges by using frequency distribution.
3. A comparison between two or more groups is possible through frequency distribution.
4. If any errors or inconsistencies remain in a score, they are easily visualized by frequency distribution.
5. To form a basic idea about the nature of any set of scores, in that case frequency distribution is very helpful.
6. By using frequency distribution, all types of graphs (graphical representation) are drawn.
7. The rate of the improvement of the students in a classroom, who is worse or who is better, is estimated by frequency distribution.
Central Tendency
If we take the achievement scores of the students of a class and arrange them in a frequency distribution, we may sometimes find that there are very few students who either score very high or very low. The marks of most of the students lie somewhere between the highest and the lowest scores of the whole class. This tendency of a group about distribution is named as central tendency and the typical score lying between the extremes and shared by most of the students is referred to as a measure of central tendency. Central tendency is when individual values of scores in a set of scores tend to move toward the centre. That is, it acts as a representative of all distributions. For example, it can be said, standing outside an examination centre, if the examinees coming out from the examination hall are asked, how was the examination? In that case, most answers would be neither good nor bad. Again, if we evaluate any exam paper, it can be seen that there are more marks obtained in the middle places. The tendency of different sets of scores to move towards the middle is called the central tendency.
Tate (1955) defines, “A sort of average or typical value of the items in the series and its function is to summarize the series in terms of this average value”.
According to Hans Raj, “Central Tendency is a device to know the position of different groups”.
According to Garrett, “Central tendency is single figure value that represents a large number of data and around which there remains the greatest amount of concentration”.
The most common measures of central tendency are:
1. Arithmetic mean or mean
2. Median
3. Mode.
Concept and their use is discussed below –
Mean
The most common measure of central tendency is the mean or average. It is a measure that we get by dividing the sum of all scores by the total number of students, called the mean.
Uses of Mean
- When the most reliable measure of central tendency is needed.
- When it is necessary to determine the significance of a number.
- Means are used for characteristic comparisons between different scores of any scale.
- Mean is chosen as a simple and straightforward method of central tendency.
Median
The median of a distribution is the point or value that divides the score into two equal parts. An equal number of scores lie above and below this value, or The median is the middle value when a data set is ordered from least to greatest.
Uses of Median
- If it is necessary to know the value of central tendency quickly in any array, then the median is used.
- The median is used when it is necessary to know the midpoint of the distribution.
- The median is used when the statistical distribution is highly skewed.
- If a number is to be divided into two equal parts, then also the median is used.
Mode
The mode of a statistical data set refers to the most frequent number occurring in the data set.
Uses of Mode
- When the value of central tendency needs to be known quickly, the mode is used.
- Without any mathematical calculations, if you want to know the value of central tendency, then mode is the most suitable measure of central tendency.
- The mode is used to find out which number occurs more often in a distribution or data set.
Bibliography
- https://byjus.com/maths/statistics-definition/
- https://studymat.in/basic-concepts-in-statistics/
- https://www.britannica.com/technology/frequency-distribution
__________________________________
Thank you for providing a positive and constructive space for discussion It’s refreshing to see a blog with a kind and respectful community
This blog is like a safe haven for me, where I can escape the chaos of the world and indulge in positivity and inspiration